Chapter 8 Access Forms / Reports
Contents
Chapter 8
Access Forms / Reports
What’s Wrong With this Form or Report
Creating a Form
A form is just another way of looking at the information in your data table or query. You can have a form that has all of your fields or only some of your fields. When we look at the database in Datasheet view we have to scroll in order to see all of the fields. We do however see several records at once. A form allows you to show (as long as they fit) all the fields on one screen; however you will only see one record at a time.
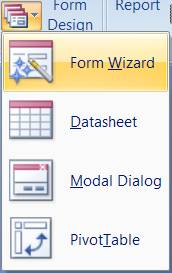 Let’s create a new form. Choose the Create Tab, the Forms Group then look for the More
Forms … icon, then choose the Form Wizard.
The form wizard does a good job and getting all the objects onto your form and
then you can modify it from there if you need to.
Let’s create a new form. Choose the Create Tab, the Forms Group then look for the More
Forms … icon, then choose the Form Wizard.
The form wizard does a good job and getting all the objects onto your form and
then you can modify it from there if you need to.
 The first step in creating your form is to
specify what table or query that you want the information to come from and then
you add the fields to the form that you want. I almost always base my forms on
a query, if I want all the records I base the form on the qryTable, if I only
want some of them I base the form a selection query. I am going to base this
form on my parameter query. This means that I can get all the records or only
some of them based upon what I type into the input box that the query gives me.
I can add the fields to the form in any order that I want (this will be the
order they appear on your form) by clicking on the field and the add one field
button (or double click the field name).
Once you have the fields that you ware interested in its time to move on
to step two.
The first step in creating your form is to
specify what table or query that you want the information to come from and then
you add the fields to the form that you want. I almost always base my forms on
a query, if I want all the records I base the form on the qryTable, if I only
want some of them I base the form a selection query. I am going to base this
form on my parameter query. This means that I can get all the records or only
some of them based upon what I type into the input box that the query gives me.
I can add the fields to the form in any order that I want (this will be the
order they appear on your form) by clicking on the field and the add one field
button (or double click the field name).
Once you have the fields that you ware interested in its time to move on
to step two.
You can really choose any layout that you want I would suggest you experiment with the different layouts to see what you get. I however generally choose Columnar for most of my forms.
As far as style goes it is your choice but I prefer the Office style over the other ones. I can format the actual form after the wizard creates it to suite my own tastes anyway.
The last step is a little misleading as it asks you what title do you want for your from and it really should say what Name do you want for your form. The 3-letter prefix for a form is frm and I am going to name/title my form as frmLastName. Now the wizard creates the form you by placing labels and text boxes on the form, which is why we let the wizard do it for us. The form itself is not all that great, one check box is at the bottom and the rest are up on the top right but hey they are all there and it saves a lot of time letting the computer place the objects on the screen.
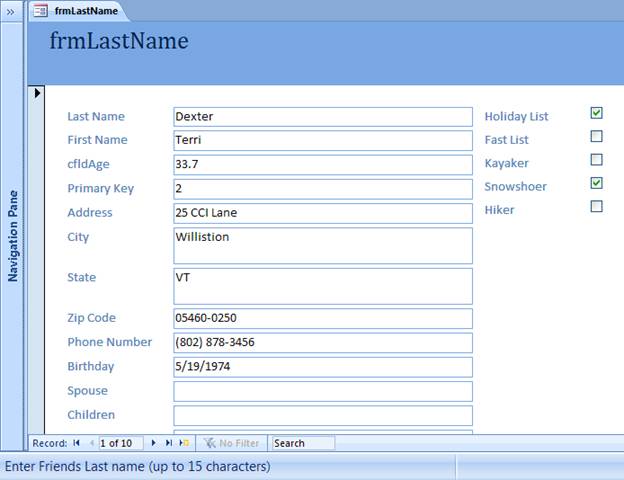
 Notice the status bar
at the bottom of the window that shows us the description from the table design.
The navigation bar just above the status bar shows us we are on record 1 with
10 records total in our database. The navigation buttons at the bottom of the
screen take you to the first record, previous record, next record and last
record and lastly add a new record. Try them so you can look at all of your
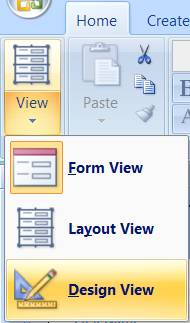
data. When you are done looking at your form, choose the Design View button so you
can modify the design.
Notice the status bar
at the bottom of the window that shows us the description from the table design.
The navigation bar just above the status bar shows us we are on record 1 with
10 records total in our database. The navigation buttons at the bottom of the
screen take you to the first record, previous record, next record and last
record and lastly add a new record. Try them so you can look at all of your
data. When you are done looking at your form, choose the Design View button so you
can modify the design.
Notice that your form has two sections, Form header and a Detail section. Basically the form header does not change as you go from one record to the next where the detail sections information will change.
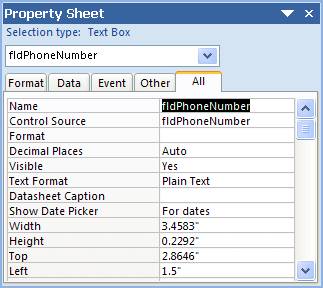
Now one concept you need to understand is that everything on the form, including the form itself is an ‘object’. All object have properties that you can change. For example this book is an object. One of the properties is the picture on the cover. I can choose any picture I want. On the form we can change all the properties for the form (there is a picture property for a form). In design view you can change the properties for any object including the form by first clicking on the object you want to change then modifying the properties.
Take a look at the edge of your form, mine is around 6.5 inches as shown. Place the mouse pointer on the edge and drag the edge to 9 inches (or more depending on the size of your monitor and resolution. Nine inches is about the size of my monitor. Basically the idea is to not have to scroll left and right. You should maximize the window to give yourself more room to work.
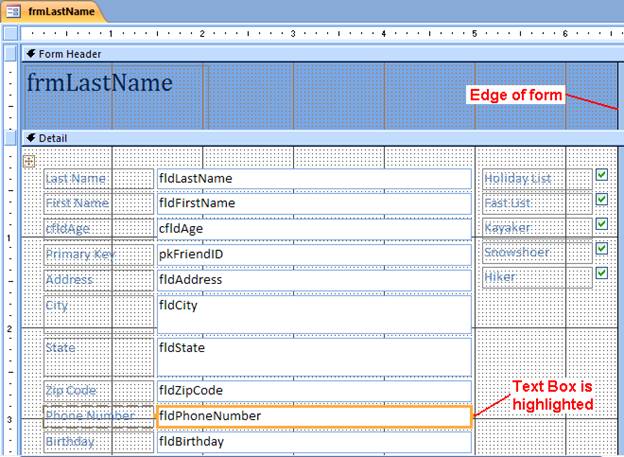
Every thing on this form is an object. You will notice that a text box is highlighted. This text box displays the contents of fldPhoneNumber when we are looking at form view. It displays fldPhoneNumber because that is what the control source property is set to (see the next figure). You can change the size of the textbox by clicking and dragging the edges or corners.
You can even change the size of the form header but if you try to drag the detail section up it won’t do anything. This is because the label that has frmLastName takes up a lot of space for some reason. If you click on this label object and resize it so that it is smaller you can then click and drag the top of the Detail section to make the Form Header smaller. So if you cannot shrink the height or width of a form header or detail section it is because there is some object that is taking up space. The object needs to be moved or resized first.
 Now
the wizard put all the labels, textboxes and check boxes on the form for us so
we do not have to. It is just easier to let the computer do this. However it is
up to us to rearrange the form to our liking. To rearrange everything I highlighted
all the objects on the form and click on the Remove
Now
the wizard put all the labels, textboxes and check boxes on the form for us so
we do not have to. It is just easier to let the computer do this. However it is
up to us to rearrange the form to our liking. To rearrange everything I highlighted
all the objects on the form and click on the Remove ![]() icon under the Form Design Tools, Arrange
Group, to remove the layout associated with these objects. I then dragged this
check box (and label) up to the group of check boxes. You should notice a small
line in the group. When you let go this places this check box as part of the
group of check boxes. This grouping lets you move everything all at once.
icon under the Form Design Tools, Arrange
Group, to remove the layout associated with these objects. I then dragged this
check box (and label) up to the group of check boxes. You should notice a small
line in the group. When you let go this places this check box as part of the
group of check boxes. This grouping lets you move everything all at once.
As I played around for some reason the check box objects became really wide and I needed to resize the width. I then needed to resize the form itself back to nine inches wide so I would not have to scroll left and right. No big deal.
You can move around all of your objects on the screen and put them where you like if you remove all the layouts. The easy way to do this is to click on the detail section of the form on the top corner (not on an object) and click and drag. You should notice the highlighting. Keep dragging until you highlight everything then click on the Remove Icon and then every object can be moved independently for ultimate control. Actually the labels will still move the associated object. In my sample below I left the check boxes as one group but rearranged everything else. For the check boxes I added a rectangle shape around them and set shape to send to back (right click, position, send to back) which layers the objects on the screen.
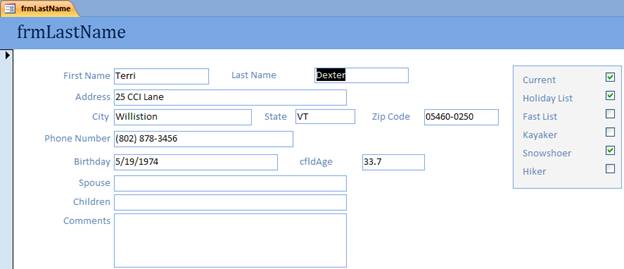
I actually spent a little more time rearranging this as I set all the labels to right aligned and resized several of the objects. I don’t think this is perfect but a start. After all if you are going to be using the form you might as well spend the time now to have it look the way you want it to.
As you click on different objects you can
look at all the properties that you can change. Go ahead and play around with
this and get the form to look the way that you want it to look. After playing
around I noticed that when I hit the tab key to go from field to field the
focus jumped all over the screen. To fix this I chose the Arrange Tab, Control Layout
Group, and the tab order icon ![]() to get a dialog box that allowed me to set the
tab order the way I wanted it. You click the gray box next to the field to
highlighted and then drag it to the position you want it. After I was done I
realized that I did not want the age text box to be tabbed to (since it was a
calculated field). I just needed to change its tab stop property to no.
to get a dialog box that allowed me to set the
tab order the way I wanted it. You click the gray box next to the field to
highlighted and then drag it to the position you want it. After I was done I
realized that I did not want the age text box to be tabbed to (since it was a
calculated field). I just needed to change its tab stop property to no.
As you change colors note that you can change the color of your text as well. You should always try to have the text in a color that is pleasing to read and contrasts with the background color. After all black text on a black background is impossible to read. Black text on any light background works well. White text on a dark background like black or dark blue works well. However red text on black or blue can be hard for many people to see. In any case it’s easy to try and see how it looks. Just click on the form view button to see how it will really look. In fact you should be comfortable jumping back and forth from design view to form view and back again.
Designing a Report
|
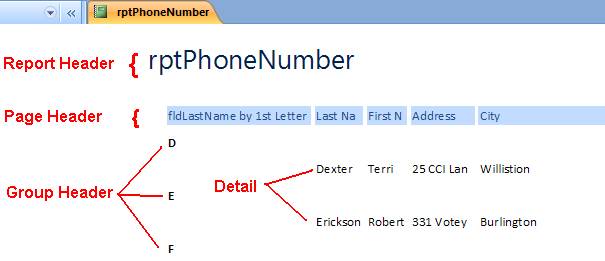
Report Section Basics 1.
Report Header
Section - Will print only at the beginning of your report
on the first page. 2.
Page Header
Section - Will print at the top of every page of your
report. Of course on the first page it will be below the report header. 3.
Group Header
Section - Will print whenever your group changes. You
sort your records on a field and have a break put in when the field changes. 4.
Detail Section - Will print
for every record you have in your data table or query. 5.
Group Footer
Section - Same as the Group Header section only this
section prints after the detail section for that group. The group footer
section is used to get totals for that group. 6.
Page Footer
Section - Will print at the bottom of every page of your
report. Commonly used for the page number. 7.
Report Footer
Section - Will print at the very end of your report. This
is used to get totals for all the records in your report. Figure 10 |
Forms allow you to view the data on a screen and reports allow you to view the data on paper. With a report view you design a report definition that will be used to print a report. Creating this report definition is really easy to do especially after understanding the basics as shown in Figure 10. The report basics deal more with understanding the terminology more so than with what you should do.
First you need to identify the fields that you will need in your report. I worked for a company that gave me a report every day that had 15 fields on it. I only needed 3 of those 15, so I threw the report away because it was too hard to read. So figure out just what information you need. Think about how you want the information sorted, for example: by name, state, age etc. I am going to generate a report for my holiday list to invite them over for a party. I want a list of their name (spouse and children), cities, states and phone numbers. I will use this list to call on them up and see if they can attend the holiday party.
Creating a Report
When making a report I suggest using the wizard to help you. Making a report is very similar to making a form. The first step is to choose the table or query that you want the information to come from, in this case qryHoliday (since I do not currently have the query I have to make it first).
Using the wizard for creating a report is the same as for a form with a couple new things. Step one is the same, you choose the table or query and pick the fields that you want on your report. Step two asks you if you want to add any grouping levels. At this time we do not so just move on to the next step.
The third step is how you define the way you want the report sorted, I am going to sort my mine by last name and first name by just choosing those fields in the list boxes. The fourth step is about how you want the report laid out. Nine out of time times I never change a thing on this step. The only time I do is when I want to report in Landscape mode. For now I am just going to keep it as a tabular report in portrait. The fifth step I also rarely change and I am just going to use Access 2007 (try some of the others, if you don’t like them just make a new report:). Finally the last step is just like the form in that it asks what title do you want when it should say what NAME do you want. Use rpt as the three letter prefix, I named my report rptHoliday.
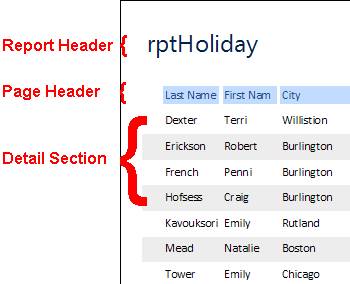
Here is part of my report in print preview. I have labeled the different sections that you can see. The Report Header, Page Header and Detail Section. This report also has a Page Footer section but I cut it off for this picture.
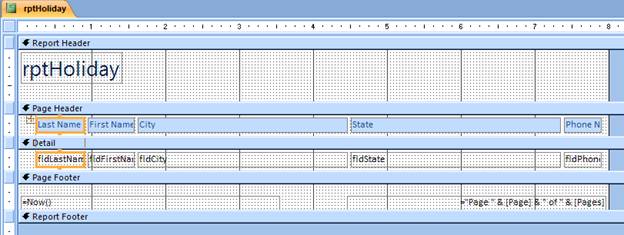
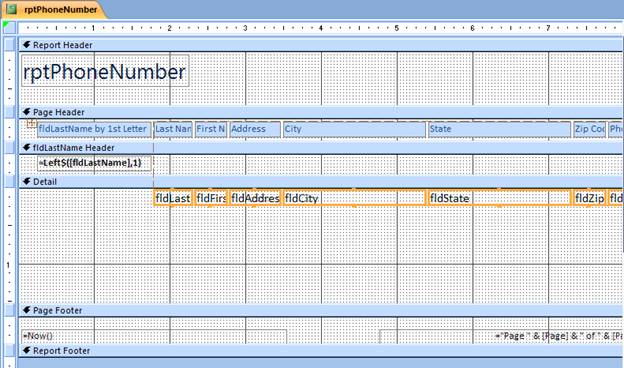
 Let’s look at the same report in design
view. Notice that just like a form there are objects, text boxes and labels.
Try to see in design view how it relates to print preview. You will notice that
both the Report Header and Page Header have nothing but labels in them. The
detail section has nothing but text boxes in them. The page footer has text
boxes with formulas in them. =Now() is a formula that is in the control source property and it will display
today’s date. =”Page “ & [Page] is a formula with the code for the page
numbers being enclosed in square brackets [ ]. Lastly you can see a Report
Footer section but notice that there is no white space under it. The white
space is ‘paper’ so to say and since there is none, nothing prints in the
Report Footer.
Let’s look at the same report in design
view. Notice that just like a form there are objects, text boxes and labels.
Try to see in design view how it relates to print preview. You will notice that
both the Report Header and Page Header have nothing but labels in them. The
detail section has nothing but text boxes in them. The page footer has text
boxes with formulas in them. =Now() is a formula that is in the control source property and it will display
today’s date. =”Page “ & [Page] is a formula with the code for the page
numbers being enclosed in square brackets [ ]. Lastly you can see a Report
Footer section but notice that there is no white space under it. The white
space is ‘paper’ so to say and since there is none, nothing prints in the
Report Footer.
If you wanted to have a Report Footer you would have to put your mouse on the bottom border of the Report Footer and click and drag to increase the white space. Then you can put objects in that section. This also holds true for the space between everyone’s name. If you move all the textboxes to the top of the Detail Section and then click and drag the Page Footer up you will get rid of the extra spacing. If you drag the right edge of any section past 8” (even 8.01”) you will cause an extra piece of paper to be printed (most likely blank).
The report wizard placed all the objects on the report for me but look at the size it gave to State which is too large and yet phone number is too small. Such is life. A little mouse work and you can resize the objects pretty much the same way as in form design.
If you wanted a list of people who liked to go kayaking you would create a similar report only basing the report on qryKayakers (the criteria for the query would be fldKayaker=Yes). In fact you could make a similar report on most any query. One report that I use all the time is my Fast List Report. I use the wizard to create a report based on the qryFastList (query criteria fldFastList=Yes) and this gives me a quick list (short list, fast list) of phone numbers of the people I call most often.
You can see that the report design view is not that much different than a form design view. Go back and look at your form design and you will see a Form Header, Form Detail, and Form Footer section. They both have the same toolbars and all the objects are pretty much the same except that forms are designed for the screen and reports are designed for the printer. This is where the report basics are important. Notice the different sections. Each section prints on a different part of the paper. The report header prints only on the first page, never again. Just the opposite is the report footer, which only prints at the end of the report. The Page Header section prints at the top of every page except for the first page where the Report Header prints above it. The detail section is where all the data from you database prints. The Detail Section prints once for every record. Lastly the Page Footer prints at the bottom of every single page, even the last one. A Report Footer would print on the last page (we did not have a Report Footer in this example) but the Page Footer acts just like a footer should and always prints at the bottom of the page.
Grouping in a Report
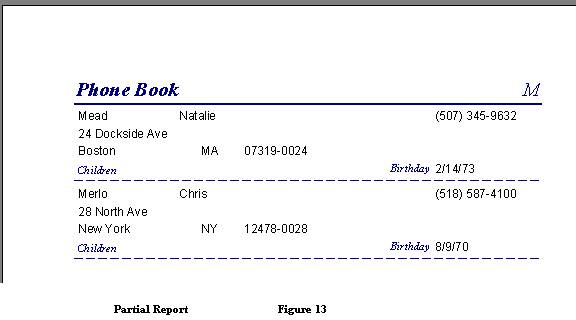
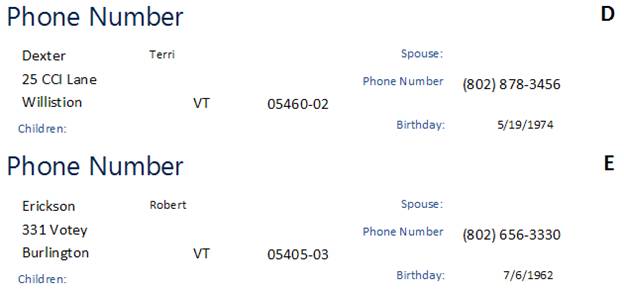
I need to print out my own phone book, I like having my phone book computerized but I really do not want to have to turn my computer on every time I call someone up. So I need a report that is similar to the next one shown where each group of names is on a new page, this figure showing just one page in the middle.
This report I am going to base on my qryTable since I want all the records to print out. So using the wizard I make a report based on qryTable and I am going to include almost all of the fields. Now the important part of using the wizard this time is when you are asked if you want to do any grouping?
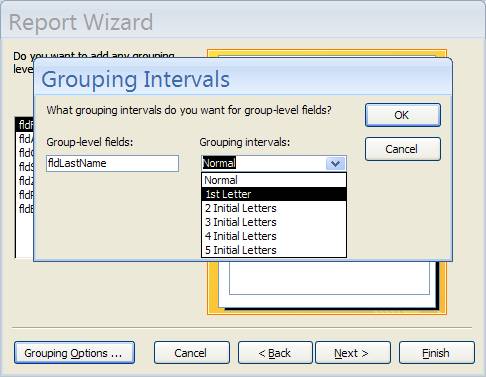
I want to group all the records by last name, the first letter of the last name. This will put all the A names together, all the B names together etc. So I add grouping by fldLastName and then I choose Grouping Options to group by the first letter of last name. You would use grouping to group all the people by state or city, or zip code for example. Specifying the grouping here is important as it enables the wizard to do a lot of work for you. You can specify grouping at any time but trust me, be sure to do it in the wizard.
After this step I just make sure that I sort by last name and first name. The rest of the steps I just allow the wizard to use what ever option. In the last step I do change the tile to reflect the naming conventions for a report and I called this report rptPhoneBook. Let’s look at this report in Print Preview.
Notice how the group header prints followed by all the records in that group (Detail Section) and then the Group Header prints again for the next group. Now this report does not look like what I am after but there is no reason why I cannot easily rearrange everything. The wizard does a great job of getting all the objects on the report that I need.
To rearrange the report I make the detail section large so that I have room to drag the objects around. I increased the size of the Detail Section by click on it first then dragging down the top of the Page Footer. I have also highlighted all the text boxes in the Detail Section (Same way as with a form). I want to make all the text font size 12 and little bigger. I will then rearrange them all in the way I want them to be on my report.
You will notice in the figure below the results of my moving things around. Notice how I took labels (spouse, children, birthday) from the page header and dragged them down to the detail section. Remember that you must remove the layout associated with the object before doing any moving around. The error icon enables you to re-associate the label.
It may take awhile to create your reports design but keep in mind that you only have to design it once and then can use it as many times as you like. Since I did not need the page header for this example I deleted all the labels and shrank the page header to no paper by dragging the Group Header up to the report header.
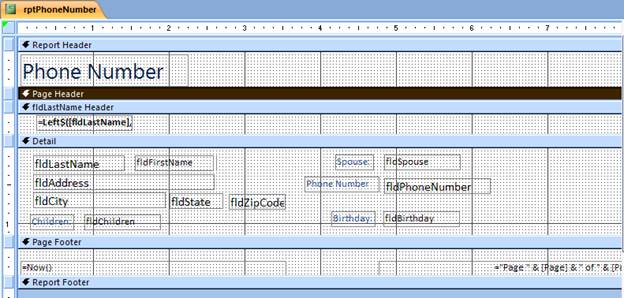
I also do not need the Report Header. What I am going to do is to change the label from rptTable to read Phone book (change the caption property) and put this in the group header. The group header will need to be larger. I am going to move the text box that is in the group header from the left side to the right side. I also made the font size larger (to match the other label) and I made it right aligned (note toolbar).
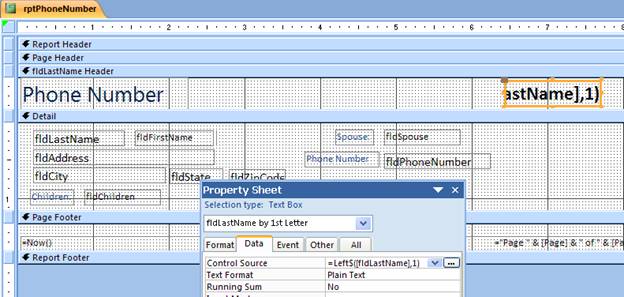
You can see the report design above. I moved things around a bit and got rid of the header sections except for the group header. I wanted you to note the Control Source property for the text box in the group header. This is a Visual Basic (computer programming language) function with the syntax: =Left$(expression, number of characters). So starting from the left side this function returns one letter from fldLastName, hence the first letter. Now we did not have to program this as the report wizard did this for us :) Let’s see how the report looks in print preview.
 Not
to bad. It would however be nice to have each group on a separate page. Easy
enough we need a page break. So what Report Section do we wan the page break
in? Let’s think about this for a minute. We have the Group header printing the
big letter D, followed by the Detail Section with Terri’s information. Then we
have another group header section printing. We could put a page break in the
detail section but that would put a page break between everyone’s name! In this
sample I only have one person in each group anyway but in real life I have more
records. The section that would print after the detail section would be the
Group Footer section but I don’t recall seeing one.
Not
to bad. It would however be nice to have each group on a separate page. Easy
enough we need a page break. So what Report Section do we wan the page break
in? Let’s think about this for a minute. We have the Group header printing the
big letter D, followed by the Detail Section with Terri’s information. Then we
have another group header section printing. We could put a page break in the
detail section but that would put a page break between everyone’s name! In this
sample I only have one person in each group anyway but in real life I have more
records. The section that would print after the detail section would be the
Group Footer section but I don’t recall seeing one.
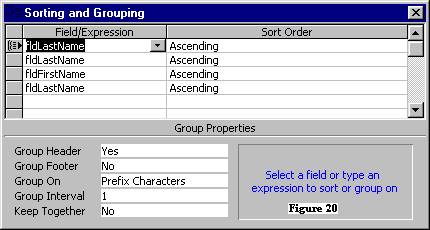
You need to add a group footer section by choosing Sorting and Grouping Icon ![]() found
on the Design tab, Grouping and Totals Group. This gets you the Group, Sort Total on the
bottom.
found
on the Design tab, Grouping and Totals Group. This gets you the Group, Sort Total on the
bottom.
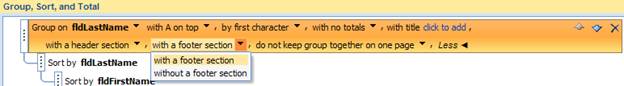
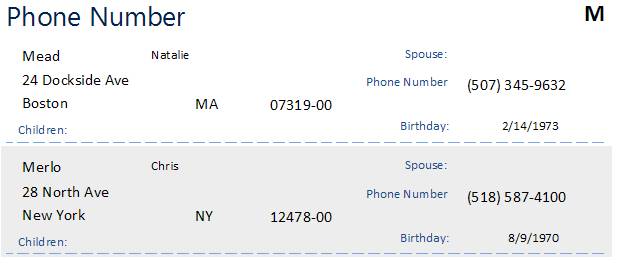
I have already added with a footer which causes a group footer section to show up. Now we only need a page break and we don’t need any white space. You need to click on the Group Footer and look at the properties and it should not take long to see one for Force New page and set that property to After Section.
Actually there was one more thing I wanted to do and that was to add a line in the detail section which I did.
Extra little tidbit: notice how none of the people in the sample report have any children. It would be nice if the label children did not show up at all. You can do this by changing the label to a text box (Right Click, Change To, TextBox) and then putting in a formula for the control source (labels don’t have a control source). The formula would be: =IIf([fldChildren]<>"","Children","") meaning that if there is something in the field then display children else display nothing. The if statement is the same in the database except it has two I’s (IIF). This prints just a blank line.
Summary Report / Group Totals
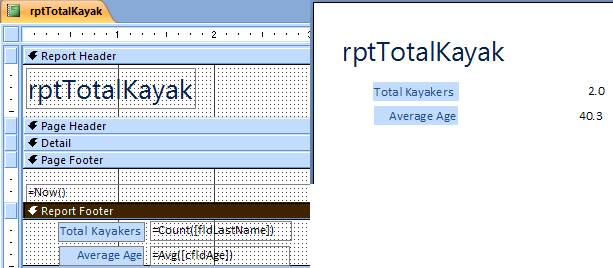
I really don’t need any other reports for a personal phone book database so let me make a few up to give you some more concepts about reports. For example suppose I wanted a report showing me the total number of kayakers and what there average age was. I would create a report based on a kayaker query and in design view I only need to use the Report Footer Section like shown in Figure 22 and Print Preview Figure 23.
I used formulas in the control source property. The first one I counted how many records there were by using the count function: =Count([fldLastName]) which counts all the non-empty fields. In other words if someone did not have last name then they would not be counted. The second function I used was the average function to get the average age of the kayakers: =Avg([cfldAge])
If you were to group the report say by State you could put the same formulas (copy the labels and textboxes) in the group footer section to get the totals and average for that group. There are many functions that you can use but that starts to get into some more advanced topics.
A report and a form are very similar in you use the wizard to put all the objects on them. The difference is that a form is meant to be viewed on a screen and a report is meant to be printed on paper. Remember that everything is an object with properties that you can set. Also keep in mind that I simplified databases in these 2 chapters. There is a HUGE amount of material about databases that you can learn, this was only a brief introduction. I hope you liked it.
What’s Wrong With this Form or Report
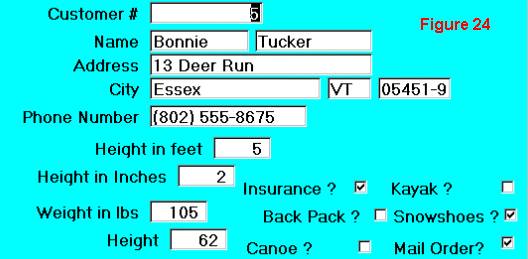
Looking at the form in Figure 24 the problem is more cosmetic. Nothing lines up smoothly. The zip code is cut off so that you cannot see all of it. It is in general just a mess. You can easily line your items up by selecting them and then setting the left property for all of them the same. To get objects align across you set the top property. Specify the width property to get the object the same width, and so on.
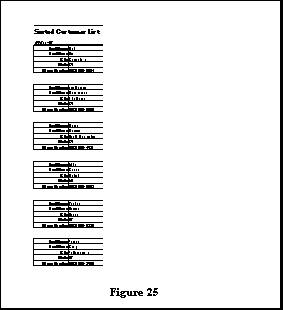 In
Figure 25 the report is wrong but can you tell why? You can not see the
actual information in this screen shot but what is wrong has to do with the
layout.
In
Figure 25 the report is wrong but can you tell why? You can not see the
actual information in this screen shot but what is wrong has to do with the
layout.
The report is only about 2” wide on an eight inch piece of paper. If you move the fields so that they are in a row instead of a column you will use less paper. The reason the report came out this way is because I used the report wizard. Always remember to check out your report in print preview even after using the wizard to see if the layout makes sense. In some cases you may want the extra white space, in this case it is just wasted paper.
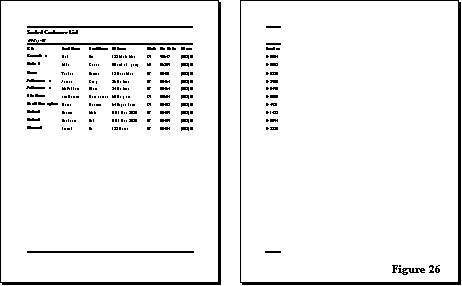
Now in Figure 26 the problem with the following report is just the
opposite. Here I have the report in a row but my row is too long because the
last field is pushed to the second page. Again, there is a huge waste of paper
and the second page if it were to stand alone would not make sense. This is
really easy to fix. What I would try first is to change the left and right
margins. If that did not work, I would try to make some of the fields a little
smaller. I could also change the orientation of the paper to landscape instead
of portrait.